# Graphs with Graphite module of Icinga
## Introduction
IML - we are the Institute for Medical Education at university in Bern, Switzerland.
We use Icinga graphite module to show performance data.
The checks are available in a sister repository.
## License
* Licence: GNU GPL 3.0
* Source:
* Graphs (Graphite): https://git-repo.iml.unibe.ch/iml-open-source/icinga-graphite-templates
* Checks: https://git-repo.iml.unibe.ch/iml-open-source/icinga-checks
## Installation
You need the graphite modul of icingaweb2 that points to a graphite service (Graphite can run on another server than Icinga).
(1)
On the Icinga server put the wanted ini into the folder
**/etc_incingaweb2/modules/graphite/templates/**
(2)
Inside an ini file have a look to the lines
check_command = "..."
They need to match the name of a service (NOT the name of a check script) to apply the rules for a graph.
## Modified templates
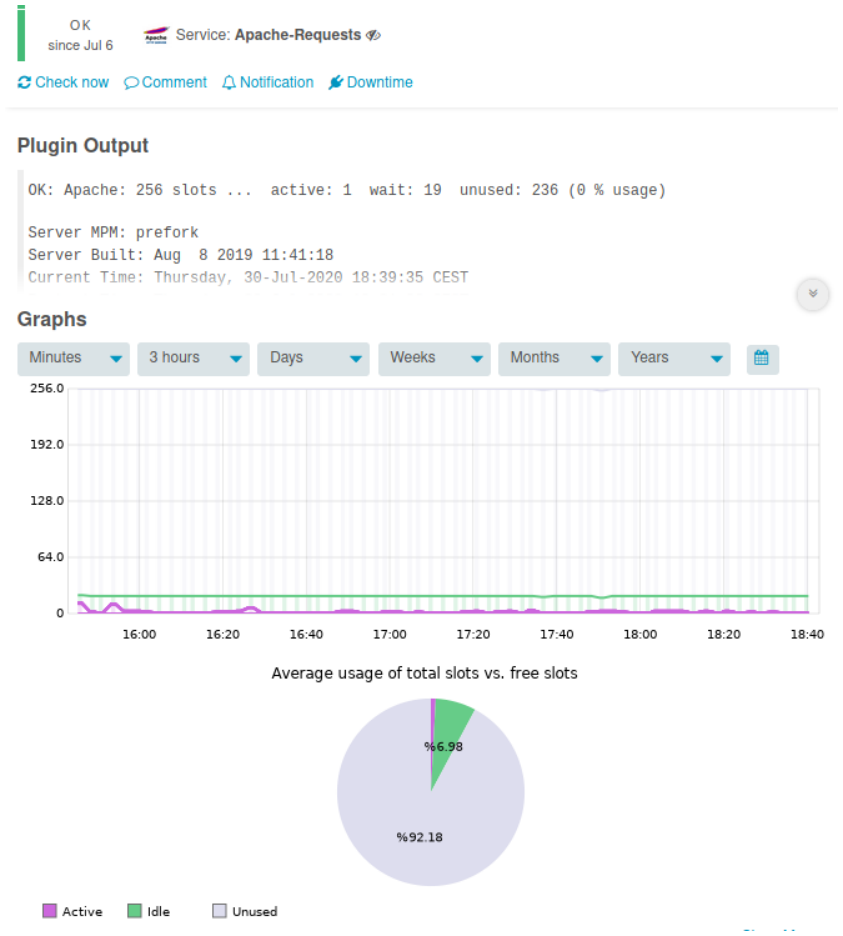
apache-requests.ini
ceph-diskfree.ini
ceph.ini
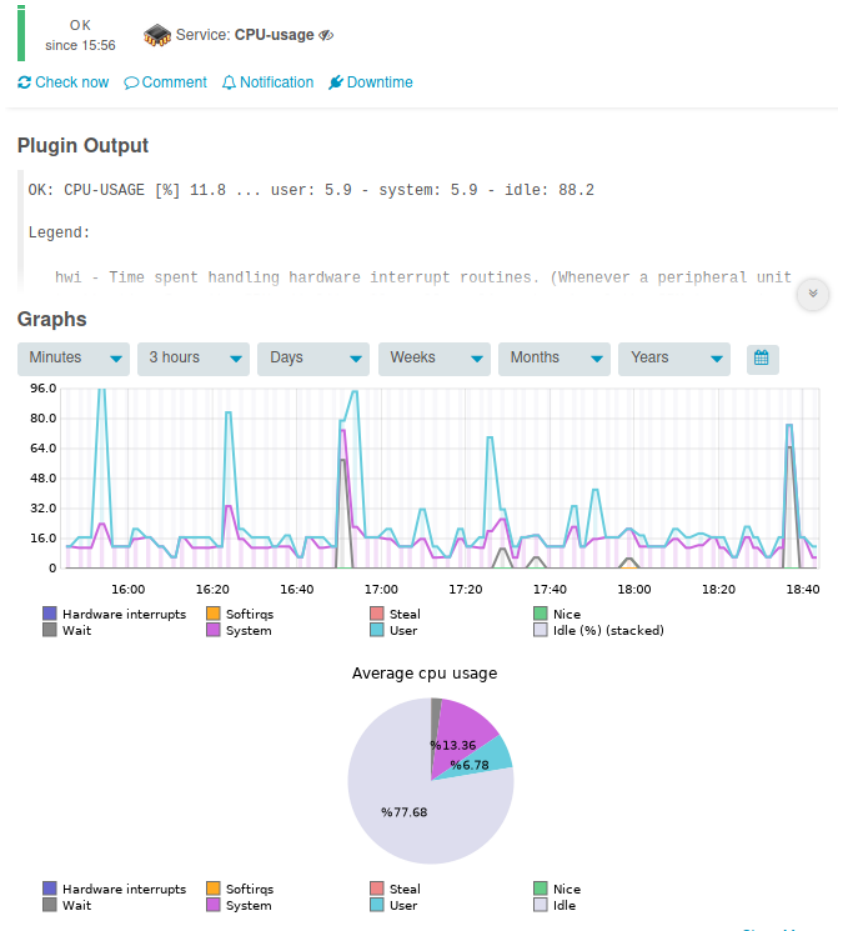
cpu.ini
default.ini
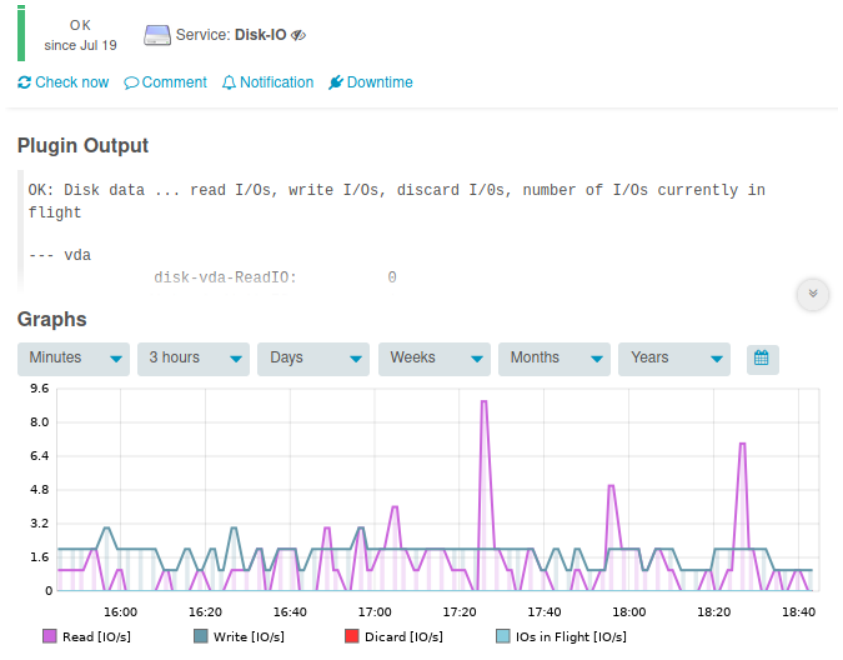
disk-io.ini
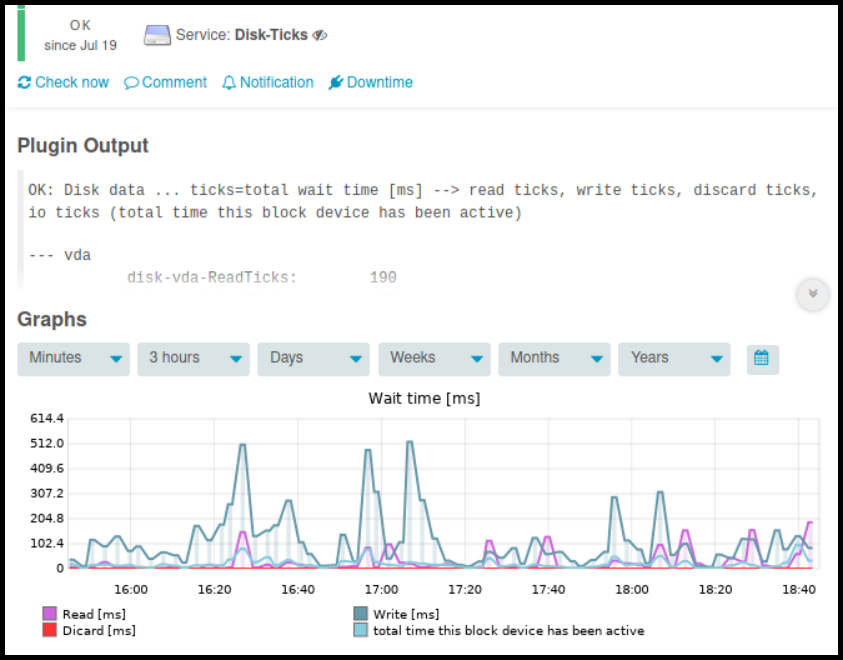
disk-ticks.ini
haproxy-status.ini
hostalive.ini
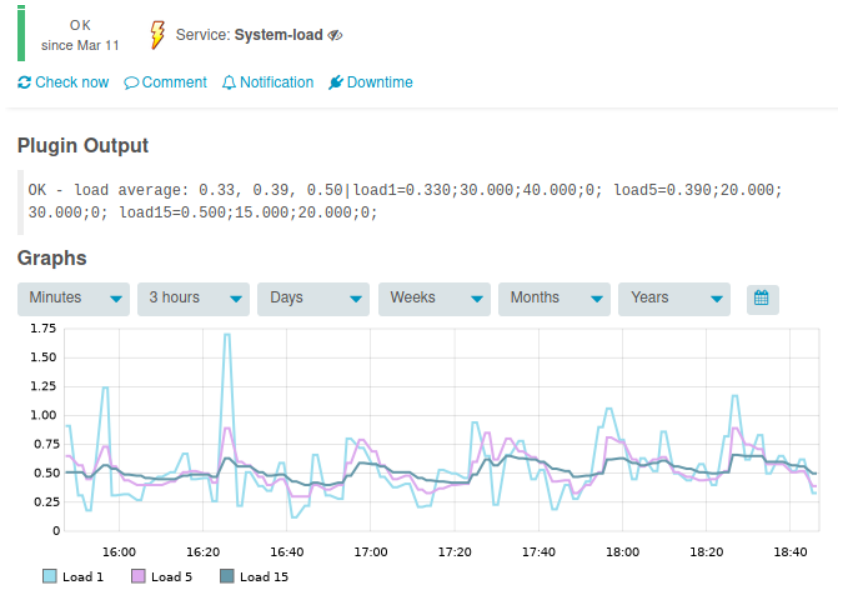
load.ini
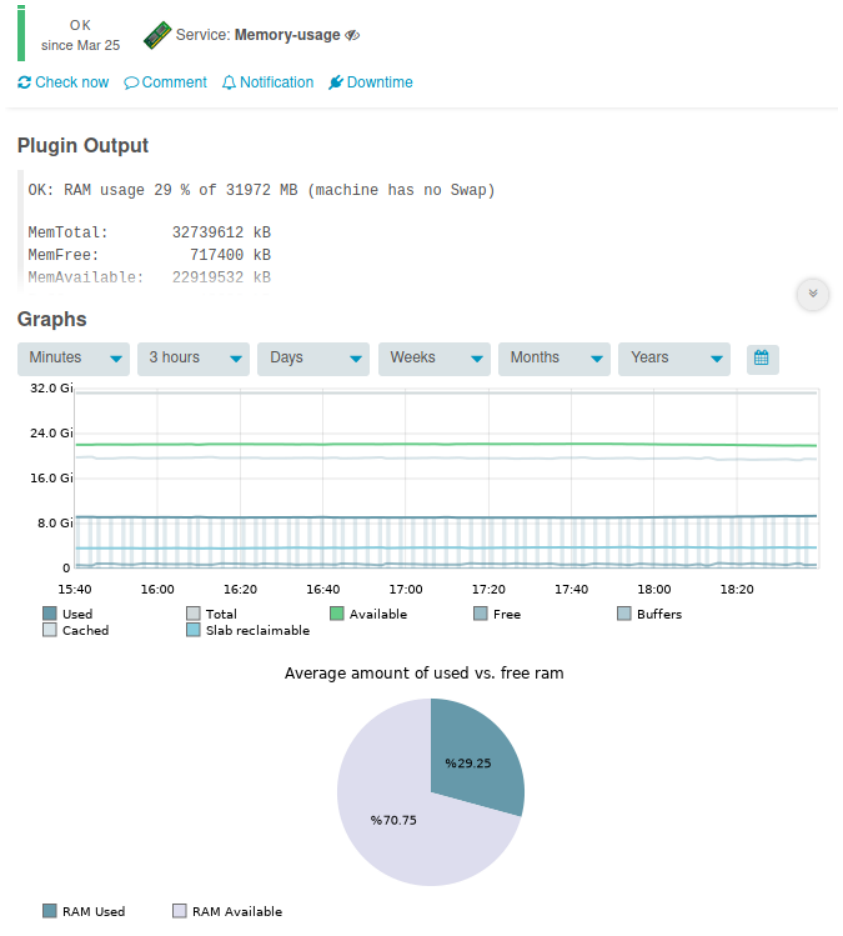
memory.ini
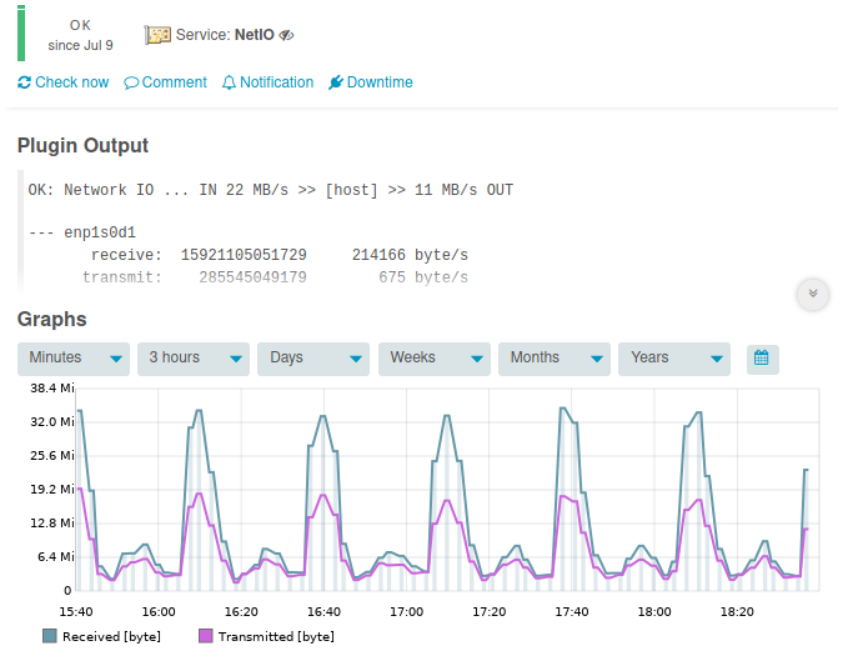
netio.ini
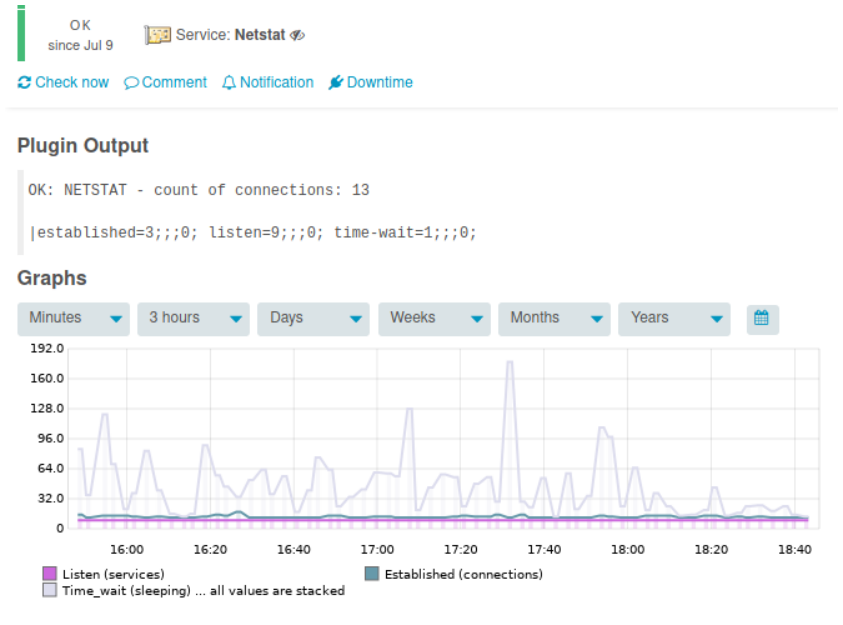
netstat.ini
response-time.ini
update-available.ini
## Gallery